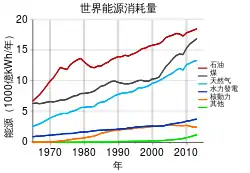
世界能源消耗量
.svg.png.webp)
資料
| 能源消耗量(PWh)[3] | ||||
|---|---|---|---|---|
| 化石燃料 | 核能 | 可再生能源 | 總共 | |
| 1990年 | 83.374 | 6.113 | 13.082 | 102.569 |
| 2000年 | 94.493 | 7.857 | 15.337 | 117.687 |
| 2008年 | 117.076 | 8.283 | 18.492 | 143.851 |
| 2000年至2008年 | 22.583 | 0.426 | 3.155 | 26.164 |
| 各國能源消耗量(人均kWh和TWh)和由1990年至2008年的增長(%)[4][5] | |||||||||
|---|---|---|---|---|---|---|---|---|---|
| 人均kWh | 人口(百萬) | 能源消耗量(千TWh) | |||||||
| 1990年 | 2008年 | 增長(%) | 1990年 | 2008年 | 增長(%) | 1990年 | 2008年 | 增長(%) | |
| 美國 | 89,021 | 87,216 | – 2% | 250 | 305 | 22% | 22.3 | 26.6 | 20% |
| 欧洲聯盟 | 40,240 | 40,821 | 1% | 473 | 499 | 5% | 19.0 | 20.4 | 7% |
| 中東 | 19,422 | 34,774 | 79% | 132 | 199 | 51% | 2.6 | 6.9 | 170% |
| 中华人民共和国 | 8,839 | 18,608 | 111% | 1,141 | 1,333 | 17% | 10.1 | 24.8 | 146% |
| 拉丁美洲 | 11,281 | 14,421 | 28% | 355 | 462 | 30% | 4.0 | 6.7 | 66% |
| 非洲 | 7,094 | 7,792 | 10% | 634 | 984 | 55% | 4.5 | 7.7 | 70% |
| 印度 | 4,419 | 6,280 | 42% | 850 | 1,140 | 34% | 3.8 | 7.2 | 91% |
| 其他 | 25,217 | 23,871 | nd | 1,430 | 1,766 | 23% | 36.1 | 42.2 | 17% |
| 全世界 | 19,422 | 21,283 | 10% | 5,265 | 6,688 | 27% | 102.3 | 142.3 | 39% |
| 資料來源:IEA/OECD, Population OECD/World Bank | |||||||||
| 能源消耗量(2008年)[6] | ||
|---|---|---|
| TWh | % | |
| 石油 | 48 204 | 33.5% |
| 煤 | 38 497 | 26.8% |
| 天然氣 | 30 134 | 20.9% |
| 核能 | 8 283 | 5.8% |
| 水力 | 3 208 | 2.2% |
| 其他可再生能源* | 15 284 | 10.6% |
| 其他 | 241 | 0.2% |
| 總共 | 143 851 | 100% |
| 資料來源:IEA * =solar, wind, geothermal and biofuels | ||
| 各國能源消耗量(人均kWh)[7][5] | ||||
|---|---|---|---|---|
| 人均kWh | 人口(百萬) | |||
| 1990年 | 2008年 | 1990年 | 2008年 | |
| 美國 | 89 021 | 87 216 | 305 | |
| 欧洲聯盟 | 40 240 | 40 821 | ||
| 中東 | 19 422 | 34 774 | 199 | |
| 中华人民共和国 | 8 839 | 18 608 | 1 333 | |
| 拉丁美洲 | 11 281 | 14 421 | 462 | |
| 非洲 | 7 094 | 7 792 | 984 | |
| 印度 | 4 419 | 6 280 | 1 140 | |
| 全世界 | 19 421 | 21 283 | 6 688 | |
| 資料來源: IEA/OECD, Population OECD/World Bank | ||||
| 能源 | 平均功率(TW)[8] | ||
| 1980年 | 2004年 | 2006年 | |
| 石油 | 4.38 | 5.58 | 5.74 |
| 天然氣 | 1.80 | 3.45 | 3.61 |
| 煤 | 2.34 | 3.87 | 4.27 |
| 水力 | 0.60 | 0.93 | 1.00 |
| 核能 | 0.25 | 0.91 | 0.93 |
| 地熱, 風能, 太陽能, 木材 | 0.02 | 0.13 | 0.16 |
| 總共 | 9.48 | 15.0 | 15.8 |
| 資料來源:The USA Energy Information Administration | |||
參考文獻
- BP: Statistical Review of World Energy 页面存档备份,存于, Workbook (xlsx), London, 2012
- . Energy Information Administration, U.S. Department of Energy. 23 August 2006 [3 April 2007]. (原始内容 (XLS)存档于2007年2月6日).
- Eenergiläget in Sweden 2011 figure 49 and 53
- Energy in Sweden 2010, Facts and figures 页面存档备份,存于 各國能源消耗量,由1990年至2008年(人均kWh)
- IEA Key energy statistics 2010 页面存档备份,存于 Population page 48 forward
- Energy in Sweden 2010, Facts and figures 页面存档备份,存于 Table 46 Total world energy supply, 1990–2009, Table 53 Global supply of renewable energy, 1990–2008 (TWh)
- Energy in Sweden 2010, Facts and figures 页面存档备份,存于 Table 55 Regional energy use, 1990 and 2008 (kWh per capita)
- World Consumption of Primary Energy by Energy Type and Selected Country Groups 页面存档备份,存于 31 December 2008 Microsoft Excel file format
外部連接
- World Energy Outlook页面存档备份,存于
- BP global energy outlook to 2035
- Energy Statistics and News from the European Union页面存档备份,存于
- Official Energy Statistics from the US government页面存档备份,存于
- Annual Energy Review页面存档备份,存于, by the U.S. Department of Energy's Energy Information Administration (PDF)
This article is issued from Wikipedia. The text is licensed under Creative Commons - Attribution - Sharealike. Additional terms may apply for the media files.