第43屆日本眾議院議員總選舉
第43屆日本眾議院議員總選舉在平成15年(2003年)11月9日舉行。這次選舉中,執政的自由民主黨(自民黨)和公明黨維持原本的執政地位。但選後使得日本政治形成兩黨制。
| ||||||||||||||||||||||||||||||||||||||||||||||||||||||||||||||||||||||||||||||||||
眾議院全部480席次 獲得絕對多數需241席 | ||||||||||||||||||||||||||||||||||||||||||||||||||||||||||||||||||||||||||||||||||
|---|---|---|---|---|---|---|---|---|---|---|---|---|---|---|---|---|---|---|---|---|---|---|---|---|---|---|---|---|---|---|---|---|---|---|---|---|---|---|---|---|---|---|---|---|---|---|---|---|---|---|---|---|---|---|---|---|---|---|---|---|---|---|---|---|---|---|---|---|---|---|---|---|---|---|---|---|---|---|---|---|---|---|
| 投票率 | 59.86% (▼4.59%) | |||||||||||||||||||||||||||||||||||||||||||||||||||||||||||||||||||||||||||||||||
| ||||||||||||||||||||||||||||||||||||||||||||||||||||||||||||||||||||||||||||||||||
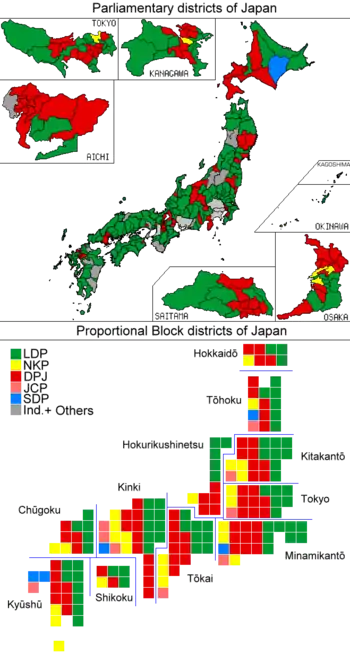 選區議席,及比例代表制選區獲勝者所屬政黨分布 | ||||||||||||||||||||||||||||||||||||||||||||||||||||||||||||||||||||||||||||||||||
| ||||||||||||||||||||||||||||||||||||||||||||||||||||||||||||||||||||||||||||||||||


選舉結果
第43屆日本眾議院議員總選舉選舉結果[1][2][3][4]如下。
| 聯盟及政黨 | 區域席次 | 比例席次 | 總席次 | 議席增減(+/−) | |||||
|---|---|---|---|---|---|---|---|---|---|
| 得票數 | 得票率(%) | 席位 | 得票數 | 得票率(%) | 席位 | ||||
| 自由民主黨 (LDP) | 26,089,326.597 | 43.85% | 168 | 20,660,185 | 34.96% | 69 | 237 | ▼10 | |
| 公明黨 | 886,507.202 | 1.49% | 9 | 8,733,444 | 14.78% | 25 | 34 | ▲3 | |
| 保守新黨 (NCP) | 791,588 | 1.33% | 4 | – | 4 | ▼5 | |||
| 執政聯盟 | 27,767,421.799 | 46.67% | 181 | 29,393,629 | 49.73% | 94 | 275 | ▼12 | |
| 民主黨 (DPJ) | 21,814,154.230 | 36.66% | 105 | 22,095,636 | 37.39% | 72 | 177 | ▲40 | |
| 日本共產黨 (JCP) | 4,837,952.810 | 8.13% | 0 | 4,586,172 | 7.76% | 9 | 9 | ▼11 | |
| 社會民主黨 (SDP) | 1,708,672.130 | 2.87% | 1 | 3,027,390 | 5.12% | 5 | 6 | ▼12 | |
| 無所屬之會 | 497,108 | 0.84% | 1 | – | 1 | ▼4 | |||
| 自由聯合 (LL) | 97,423 | 0.16% | 1 | – | 1 | ▬0 | |||
| 其他諸派 | 51,524 | 0.09% | 0 | – | 0 | ▼2 | |||
| 在野黨總計 | 31,456,834.170 | 48.75% | 108 | 29,709,198 | 50.27% | 86 | 194 | ▲11 | |
| 獨立人士 | 2,728,118 | 4.58% | 11 | – | 11 | ▲6 | |||
| 總計 | 59,502,373.969 | 100.00% | 300 | 59,102,827 | 100.00% | 180 | 480 | ▲5 (新席位) | |
| 投票率 | 59.86% (-4.59) | 59.81% (-2.68) | – | ||||||
參考資料
- Mainichi Shimbun: Analysis of the general election (in Japanese)
- Ministry of Internal Affairs and Communications: Election results, Vote totals taken from "Previous election" sections in 2005 election results
- The Senkyo: Results of the 43rd House of Representatives election by PR block and district 页面存档备份,存于
- Yomiuri Shimbun: 2003 general election feature in the Internet Archive
- Asahi Shimbun: 2003 general election feature in the Internet Archive
This article is issued from Wikipedia. The text is licensed under Creative Commons - Attribution - Sharealike. Additional terms may apply for the media files.
