QtiPlot
QtiPlot 是一个跨平台的数据分析和科学可视化软件。它的主要开发者是 Ion Vasilief。
 | |
| 開發者 | Ion Vasilief |
|---|---|
| 穩定版本 | 0.9.8.9 (2011年11月2日) |
| 源代码库 | |
| 操作系统 | 跨平台 |
| 类型 | 数据分析 |
| 许可协议 | GNU 通用公共许可证 |
| 网站 | |
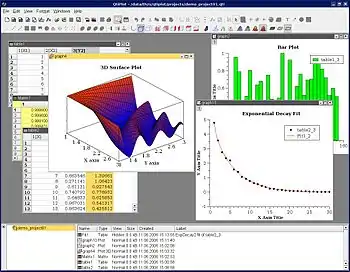
QtiPlot 的界面与同类软件Origin、SigmaPlot[1] 类似。此类软件大多是专利软件,且价格昂贵,因此,很多人(尤其是大学生)常用QtiPlot 来替代其它同类软件[2]。QtiPlot 可以用于制作二维和三维的数据图表,并具有许多诸如曲线拟合这样的数据分析功能。Plotting of 3D data can be rendered using OpenGL using the Qwt3D libraries.
QtiPlot 属于自由软件,采用GNU 通用公共许可证(GPL)发布。针对微软 Windows、某几种Linux发行版以及Mac OS X平台,QtiPlot 同时提供编译好的二进制文件。使用者须要付费才能下载和使用这些二进制版本文件(demo版现在可以免费下载,但只能使用很短的时间);但是,任何人都可以在GPL下自由地重新编译和分发QtiPlot[3]。目前,在Linux平台和Windows平台,都有这样的第三方分发者[4][5][6][7][8][9][10][11]。
参考
- . [2011-04-19]. (原始内容存档于2011-03-18).
- . [2011-04-19]. (原始内容存档于2011-09-28).
- . [2011-04-19]. (原始内容存档于2011-07-20).
- . [2011-04-19]. (原始内容存档于2012-07-17).
- . [2011-04-19]. (原始内容存档于2011-07-27).
- . [2011-04-19]. (原始内容存档于2011-07-27).
- . [2011-04-19]. (原始内容存档于2012-07-16).
- . [2011-04-19]. (原始内容存档于2011-07-24).
- . [2011-04-19]. (原始内容存档于2012-07-13).
- . [2011-04-19]. (原始内容存档于2011-07-27).
- . [2011-04-19]. (原始内容存档于2011-04-12).
外部链接
This article is issued from Wikipedia. The text is licensed under Creative Commons - Attribution - Sharealike. Additional terms may apply for the media files.
