曲線擬合
曲線擬合(fit theory),俗稱拉曲線,是一種把現有數據透過數學方法來代入一條數式的表示方式。科学和工程问题可以通过诸如采样、实验等方法获得若干离散的数据,根据这些数据,我们往往希望得到一个连续的函数(也就是曲线)或者更加密集的离散方程与已知数据相吻合,这过程就叫做拟合 (fitting)。
本條目講述如何透過拉曲線的方法來進行插值法運算及遞歸分析的基礎。
类型
將函數擬合至數據點 (Fitting functions to data points)
最常見的是,一函數符合 y=f(x) 的形式。
(Most commonly, one fits a function of the form y=f(x).)
拟合直線或多項式曲線
方程在笛卡尔平面上是一條直線,而這條直線的斜率是a。因為任何兩點可以決定一條直線,因此總能找到次數不多於1的多項式來串起任何兩個x值相異的點。

如果把多次式的次數增加到2

那麼只要給定x值各異的3點,總會有次數不多於2的多項式可以把它們串起。
如果把多次式的次數再增加到3

那麼只要給定x值各異的4點,總會有次數不多於3的多項式可以把它們串起。
對於這條多項式,更正確的描述是這條多項式附合任何4個限制。限制可以是一點(x,y)、角度或曲率(即半徑的倒數 1/R)。角度和曲率的限制通常在曲線的終端,因此稱為終端條件 。為了樣條(spline) 的交接平滑,通常會用到全等的終端條件。 也可以增加如曲率变化等高阶约束。例如,在高速公路立体交叉点苜蓿葉型的设计中,可以用来理解当汽车绕着交叉点运动时作用在汽车上的力,并依此设定合理的限定时速。
一次多项式也可以拟合一个单点和一个角度,三次多项式则可以拟合两点,一个角度约束以及一个曲率约束。许多其它类型的约束组合也同样可以用低阶或者高阶多项式来拟合。
如果有超过n+1个约束(n是多项式的阶次),仍然可以使用多项式拟合。通常一个满足所有约束的精确拟合不一定能够得到(但是有可能得到,例如,用一次多项式拟合共线的三点三点共线)。通常,我们需要使用一些方法来评价拟合的好坏。最小平方法就是用来评价差别的一种常用的方法。
不通过提高多项式的次数来更好的拟合曲线的原因有下:
- 即使存在精确的拟合,也不意味着必须得到这样的拟合。根据使用的算法不同,我们可能遇到分歧,要么精确的拟合无法得到,要么需要太多的计算机时去得到精确的拟合。不管哪种情况,最终都会以得到近似拟合而结束。
- 通常人們會希望得到一个近似的拟合,而不愿为了精确拟合数据而使拟合的曲线产生扭曲。
- 高次多项式往往有高度波动的特性。如果我们通过两点“A”和“B”作一条曲线,我们希望这条曲线也能通过“A”和“B”的中点。但是对于高次多项式,情况就不是这样了,高次多项式曲线往往可能有很大或者很小的幅值。对于低次多项式,曲线将没有很大波动,而能通过中点(对于一次多项式,甚至能保证肯定通过中点)。
將其他函數擬合至數據點 (Fitting other functions to data points)
其他類型的曲線在特定條件下也可使用,諸如三角函數 (如正弦或餘弦函數)。
在光譜學中,數據可以使用高斯、柯西、福格特等相關函數來擬合。
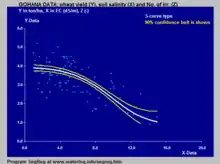
在農業中,S函數被用於描述作物產量和生長因子之間的關係。右方藍色的圖表是將農田中的測量數據進行S形回歸得出的。可以看出作物產量在土壤鹽度增加時先緩慢降低,之後降得更快,最終又變為緩和。
將平面曲線擬合至數據點 (Fitting plane curves to data points)
If a function of the form cannot be postulated, one can still try to fit a plane curve.

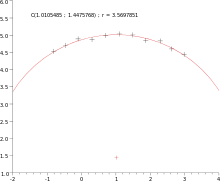
Other types of curves, such as conic sections (circular, elliptical, parabolic, and hyperbolic arcs) or trigonometric functions (such as sine and cosine), may also be used, in certain cases. For example, trajectories of objects under the influence of gravity follow a parabolic path, when air resistance is ignored. Hence, matching trajectory data points to a parabolic curve would make sense. Tides follow sinusoidal patterns, hence tidal data points should be matched to a sine wave, or the sum of two sine waves of different periods, if the effects of the Moon and Sun are both considered.
For a parametric curve, it is effective to fit each of its coordinates as a separate function of arc length; assuming that data points can be ordered, the chord distance may be used.[1]
Fitting a circle by geometric fit
Coope[2] approaches the problem of trying to find the best visual fit of circle to a set of 2D data points. The method elegantly transforms the ordinarily non-linear problem into a linear problem that can be solved without using iterative numerical methods, and is hence an order of magnitude faster than previous techniques.
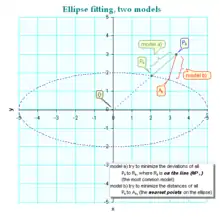
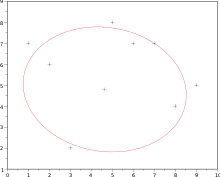
Fitting an ellipse by geometric fit
The above technique is extended to general ellipses[3] by adding a non-linear step, resulting in a method that is fast, yet finds visually pleasing ellipses of arbitrary orientation and displacement.
参见
外部連結
- Curve Expert (shareware) fits functions to data (limited to one dependant and one independent variable.)
- Zunzun.com Online curve and surface fitting
- TableCurve2D and TableCurve3D by Systat 页面存档备份,存于 automates curve fitting
- another choice 页面存档备份,存于
- online curve-fitting textbook 页面存档备份,存于
- Interactive curve fitting using Least Squares with Weights on savetman.com
参考资料
- p.51 in Ahlberg & Nilson (1967) The theory of splines and their applications, Academic Press, 1967
- Coope, I.D. . Journal of Optimization Theory and Applications. 1993, 76 (2): 381–388. doi:10.1007/BF00939613.
- Paul Sheer, A software assistant for manual stereo photometrology, M.Sc. thesis, 1997
