全球飢餓指數
全球飢餓指數(GHI)是一個多層面的統計工具,用於描述國家的飢餓狀況。可利用GHI評估全球對抗飢餓方面的進步和失敗。[1]GHI每年更新一次。
該指數由國際糧食政策研究所(IFPRI)採納和進一步發展,並於2006年首次在德國非營利組織(NGO)救济世界饥饿组织(Welthungerhilfe)發表。2007年以來,愛爾蘭非政府組織關注世界作為共同發行人加入團體。[2][3][4][5]
在2009年,GHI對121個發展中國家和轉型期國家進行了計算,其中84位進入排名。GHI的報告每年聚焦於一個主要的主題:在2009年,該指數衡量飢餓與性別平等之間的聯繫。[6][7]此外,還對飢餓狀況對金融危機的影響進行了分析。在年度GHI之外,印度國家飢餓指數(ISHI)於2008年發表[8],以及衣索比亞次國家飢餓指數於2009年發表[9]。
指数的计算方式
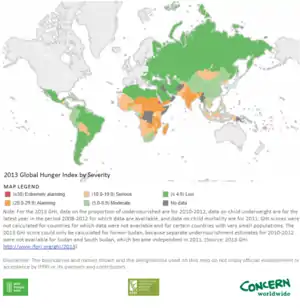
指数以百分制来衡量一个国家,其中0为最佳(“不存在饥饿”)100为最差(亦即分數越高,該國的食物狀況越差,儘管這兩個極端都不是在實踐中取得)。分數低於4.9表示「低飢餓」,分數在5至9.9之間表示「適度飢餓」,10至19.9之間表示「嚴重饥饿」,20至29.9之間表示「驚人」,而30以上表示「非常令人擔憂的」飢餓問題。
GHI包括三個同等分量的加權指標:
- 營養不良者占人口的百分比;
- 五歲以下體重不足兒童的發生率;
- 五歲以下兒童的死亡率。[5]
2009年GHI使用的數據為2002至2007年期間,也就是最近獲得的GHI三個組成部分的全球數據。這些數據當中,營養不良的比例來自聯合國糧食及農業組織,期間為2003年至2005年的数据。[10]5歲以下兒童體重不足的數據是根據由世界衛生組織(WHO)[11]、聯合國兒童基金會(UNICEF)[12][13]和人口統計與健康調查(MEASURE DHS)[14]根據收集到的在2002-07年期間最新資料和數據,而兒童死亡率是2007年兒童基金會的數據。2009年GHI和以新算法重新計算的1990年GHI,不能直接與舊算法的GHI值相比較。
排名
| 全球飢餓指數[15] | ||||
|---|---|---|---|---|
| 排名 | 國家 | 1992 | 2000 | 2016 |
| 118 | 52.2 | 48.0 | 46.1 | |
| 117 | 62.5 | 51.9 | 44.3 | |
| 116 | 47.1 | 50.4 | 39 | |
| 115 | 51.6 | 42.8 | 36.9 | |
| 114 | 44.6 | 44.2 | 35.4 | |
| 113 | 43.8 | 43.2 | 35 | |
| 112 | 57.8 | 53.9 | 35 | |
| 排名 | 國家 | 2016 |
|---|---|---|
| 111 | 34.8 | |
| 110 | 34.3 | |
| 109 | 33.7 | |
| 108 | 33.4 | |
| 107 | 33.4 | |
| 106 | 32.8 | |
| 105 | 32.7 | |
| 104 | 31.7 | |
| 103 | 31.4 | |
| 102 | 31 | |
| 101 | 30.7 | |
| 100 | 30 | |
| 99 | 28.8 | |
| 98 | 28.6 | |
| 97 | 28.5 | |
| 96 | 28.4 | |
| 95 | 28.1 | |
| 94 | 28.1 | |
| 93 | 28.1 | |
| 92 | 27.4 | |
| 91 | 27.4 | |
| 90 | 27.1 | |
| 89 | 26.9 | |
| 88 | 26.6 | |
| 87 | 26.4 | |
| 86 | 25.7 | |
| 85 | 25.5 | |
| 84 | 25.5 | |
| 83 | 24.2 | |
| 82 | 23.2 | |
| 81 | 23 | |
| 80 | 22.9 | |
| 79 | 22.7 | |
| 78 | 22.4 | |
| 77 | 22.1 | |
| 76 | 22 | |
| 75 | 22 | |
| 74 | 21.9 | |
| 73 | 21.9 | |
| 72 | 21.9 | |
| 71 | 21.7 | |
| 70 | 20.9 | |
| 69 | 20.7 | |
The Global Hunger Index is composed of the proportion of the undernourished as a percentage of the population, the prevalence of underweight children under the age of five and the mortality rate of children under the age of five (calculated average, in percentages).
The 2016 GHI score could not be calculated for Bahrain, Bhutan, Burundi, the Comoros, the Democratic Republic of the Congo, Eritrea, Libya, Papua New Guinea, Qatar, Somalia, South Sudan, Sudan, and the Syrian Arab Republic, because of a lack of data.[GHI2016 1]
全球及区域趋势
2009年GHI報告顯示了自1990年以來在全球、區域和國家層面之飢餓狀況的發展。從全球來看,GHI下跌了近四分之一,由20分下降到15.2分。虽然表现出积极的趨勢,全球對抗飢餓的進程依然停滯不前,沒有達到足夠快速的目標。全球的平均數掩蓋了各地區和國家的巨大差異。29個國家的飢餓狀況仍然在令人震驚(20-29.9)或極其令人擔憂(≥30)的水準。與1990年相比,撒哈拉以南非洲地區的2009年GHI下降了13%,其中約25%在南亞,32%在近東和北非。東南亞和拉丁美洲的進展尤其巨大,GHI下降超過40%。
撒哈拉以南非洲和南亞有著最高的區域GHI得分(22.1和23.0),但兩個地區的糧食安全問題是源於不同的原因:在南亞,主要問題是婦女的低營養和教育水平,造成體重不足的五歲以下兒童高患病率。與此相反,撒哈拉以南非洲地區的高GHI是由於兒童的高死亡率和很大比例的人無法滿足熱量需求。
参见
- 各國營養不良人口比例列表
注释
- (PDF). [2017-08-04]. (原始内容 (PDF)存档于2020-07-24).
参考文献
- . BBC (Europe). 2009-10-14 [2010-08-22]. (原始内容存档于2018-10-23).
- IFPRI/ Welthungerhilfe: The Challenge of Hunger − Global Hunger Index: Facts, determinants, and trends. Case studies of post conflict countries of Afghanistan and Sierra Leone 页面存档备份,存于. Bonn, October 2006.
- IFPRI/ Concern/ Welthungerhilfe: The Challenge of Hunger 2007 − Global Hunger Index: Facts, determinants, and trends 2007 页面存档备份,存于. Measures being taken to reduce acute undernourishment and chronic hunger. Bonn, October 2007.
- IFPRI/ Concern/ Welthungerhilfe: Global Hunger Index − The Challenge of Hunger 2008 页面存档备份,存于. Bonn, Washington D.C., Dublin. October 2008.
- IFPRI/ Concern/ Welthungerhilfe: 2009 Global Hunger Index − The Challenge of Hunger: Focus on Financial Crisis and Gender Inequality 页面存档备份,存于. Bonn, Washington D. C., Dublin. October 2009.
- 2009 Global Hunger Index - Summary 页面存档备份,存于, IFPRI, Washington, DC
- . [2010-10-01]. (原始内容存档于2013-07-29).
- Menon, Purnima / Deolalikar, Anil / Bhaskar, Anjor: India State Hunger Index (2009): Comparison of Hunger Across States 页面存档备份,存于
- Schmidt, Emily / Dorosh, Paul (October 2009): A Sub-National Index for Ethiopia: Assessing Progress in Region-Level Outcomes 页面存档备份,存于. International Food Policy Research Institute (IFPRI) and Ethiopian Development Research Institute (EDRI): ESSP-II Discussion Paper 5.
- State of food insecurity in the world 2008 页面存档备份,存于. Food and Agriculture Organization. Rome, 2008.
- Global database on child growth and malnutrition 页面存档备份,存于. World Health Organization. Geneva, 2009.
- United Nations Children’s Fund. 2009. The state of the world’s children 2009: maternal and newborn health. New York.
- UNICEF. 2009b. Childinfo statistics on child nutrition. New York.
- MEASURE DHS. 2009. Demographic health surveys 页面存档备份,存于. Calverton, USA.
- K. von Grebmer, J. Bernstein, A. de Waal, N. Prasai, S. Yin, Y. Yohannes: 2015 Global Hunger Index - Armed Conflict and the Challenge of Hunger. Bonn, Washington D. C., Dublin: Welthungerhilfe, IFPRI, and Concern Worldwide. October 2015.
- The Global Gender Gap Report 2009 页面存档备份,存于. World Economic Forum.
- Women’s UN Report Network (WUNRN), What does gender have to do with hunger? 页面存档备份,存于
進階閱讀
- Von Braun, J. (2000): Wie die Welternährung im 21. Jahrhundert sichern? In: Jahrbuch Welternährung: Daten, Trends, Perspektiven. Fischer Taschenbuchverlag, S.34–37.
- Schmidt, Emily / Dorosh, Paul (Oktober 2009): A Sub-National Index for Ethiopia: Assessing Progress in Region-Level Outcomes页面存档备份,存于. International Food Policy Research Institute (IFPRI) and Ethiopian Development Research Institute (EDRI): ESSP-II Discussion Paper 5. (Accessed on December 11, 2009)
- Menon, Purnima / Deolalikar, Anil / Bhaskar, Anjor: India State Hunger Index (2009): Comparison of Hunger Across States页面存档备份,存于. (Accessed on December 11, 2009)
- Wiesmann, Doris / von Braun, Joachim / Feldbrügge, T. (2000): An International Nutrition Index: successes, failures in addressing hunger and malnutrition页面存档备份,存于. Center for Development Research (ZEF) Discussion Paper on Development Policy No. 26 (PDF, 397 KB - Accessed on December 11, 2009)
- Wiesmann, Doris (2004): An international nutrition index: concept and analyses of food insecurity and undernutrition at country levels. Development Economics and Policy Series 39. Peter Lang Verlag.