世界各地区历史上的国内生产总值列表 (购买力平价)
本頁內所述之地区并不全然以一国為準。例如阿拉伯帝国、古羅馬、阿契美尼德王朝等横亘多个地区的国家於列表中乃根据曾記載的数值換算來相应。美元数目是以当前美元价值为基础,並納入购买力平价之后考量的預估;相關預估来自于所引用的参考文献。和其他一切对历史上的经济数值之評估一样,相關之貨物與價值上的計算可能有些或者不全然确,仅備參閱人評估參考。
1年
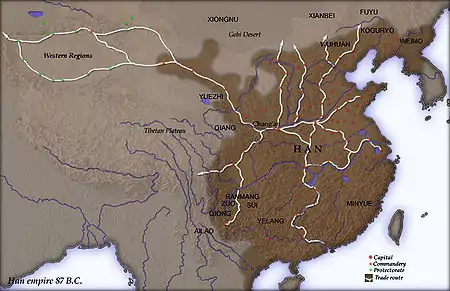
漢朝最大疆域圖(前87年)
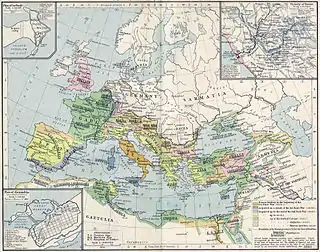
羅馬帝國疆域圖
|
1000年
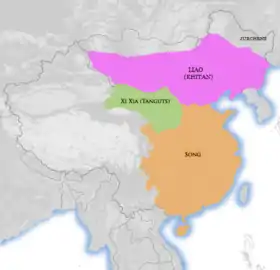
北宋,辽,西夏疆域圖(1111年)
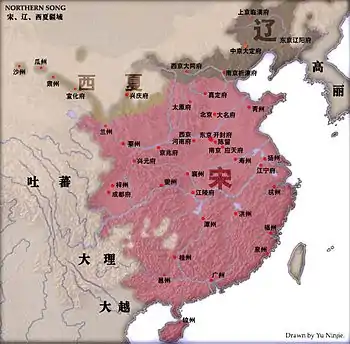
宋朝最大疆域圖(1111年)

阿拉伯帝國-阿巴斯王朝最大疆域圖
|
1500年
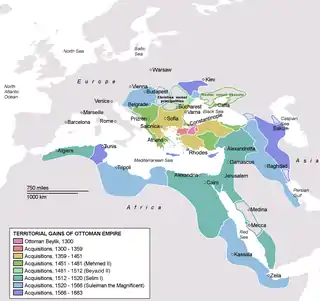
奧圖曼帝國疆域擴張圖(1299年—1683年)
|
1600年

莫卧儿帝國最大疆域圖(1700年)
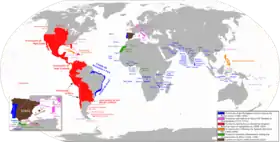
西班牙帝國最大疆域圖(1630年)
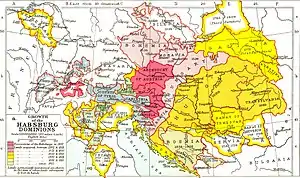
奧地利哈布斯堡王朝疆域擴張圖
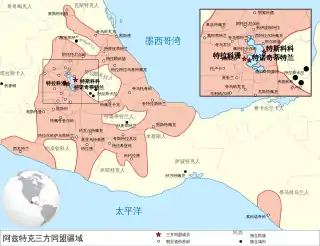
阿茲提克帝國疆域圖
|
1700年
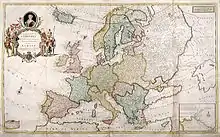
歐洲情勢圖(1708年)

德意志-普魯士王國疆域擴張圖(1600年至1795年)
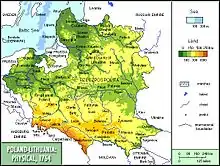
波蘭立陶宛聯邦地理圖(1764年)
|
1820年
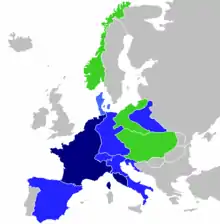
歐洲-拿破崙時代情勢圖(1789年至1814年)
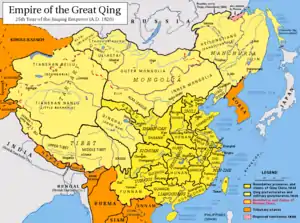
清朝最大疆域圖(1820年)
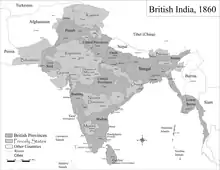
英屬印度疆域圖(1860年)
|
1870年

大英帝國疆域圖(1897年)

歐洲情勢圖-拿破崙時代結束後(1815年)
-de.svg.png.webp)
歐洲-德意志第二帝國疆域圖(1871年)
|
1913年
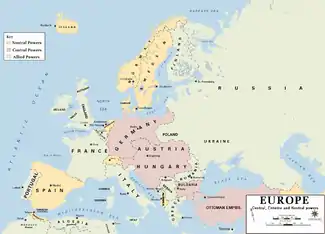
歐洲情勢圖(1914年)
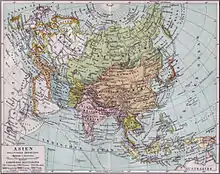
亞洲情勢圖(1890年)

澳州領變遷圖(1788年至1989年)
|
1950年
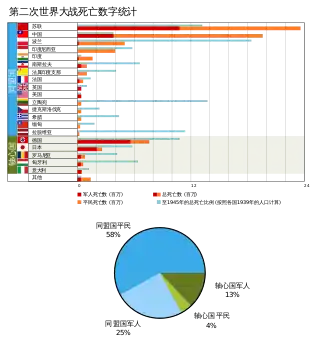
二戰各國死亡人口估計
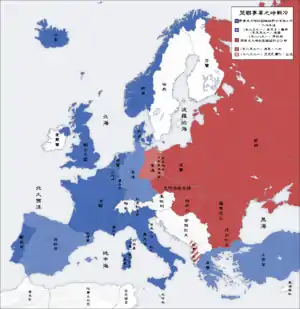
歐洲情勢圖(1950年)
|
1973年
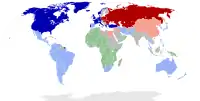
世界情勢圖(1959年)
北大西洋公约组织成员国
美国的盟国
殖民地
华沙公约组织成员国
苏联的盟国
不结盟国家
|
1998年
|
2001年
|
2016年
| 名次 | 國家 | GDP (PPP) 百萬美金$ [66] |
GDP比例 世界百分比(%) |
|---|---|---|---|
| 世界 | 113,523,500 | 100 | |
| 1 | 18,624,500 | 14.48 | |
| 2 | 19,205,364 | 16.92 | |
| 3 | 11,258,380 | 9.71 | |
| 4 | 8,642,758 | 7.63 | |
| 5 | 4,901,102 | 4.32 | |
| 6 | 3,934,664 | 3.47 | |
| 7 | 3,684,643 | 3.25 | |
| 8 | 3,101,247 | 2.74 | |
| 9 | 3,010,746 | 2.65 | |
| 10 | 2,756,748 | 2.43 | |
| 11 | 2,703,378 | 2.38 | |
| 12 | 2,227,176 | 1.96 | |
| 13 | 2,170,909 | 1.91 | |
| 14 | 1,848,518 | 1.63 | |
| 15 | 1,720,027 | 1.52 | |
| 16 | 1,665,332 | 1.47 |
註釋
- 是西亚、埃及、摩洛哥、阿爾及利亞、突尼西亞、西西里島與意大利南部的GDP總合(估計為當時義大利全境的50%)、西班牙與葡萄牙於1000年為$21,640[9]。
- 為西班牙、新西班牙副王區、米蘭公國、拿坡里王國、西西里島與薩丁尼亞之GDP總額(估計為當時義大利全境的50%)、南美洲、中美洲、比利時、墨西哥和葡萄牙(1580年至1640年間與西班牙合併)。
- 是西班牙、米蘭公國、拿坡里王國、西西里島、薩丁尼亞的GDP總合(估計為當時義大利全境的50%)、南美洲、中美洲、比利時與墨西哥。
- 英國本土、英屬印度、加拿大、澳大利亞、紐西蘭、錫蘭、香港、新加坡與南非的GDP總合;1870年約$2650億[37]。
- 1913年之英國、英屬印度、加拿大、澳大利亞、紐西蘭、錫蘭、英屬馬來亞、香港、新加坡、埃及、迦納與南非GDP總額約$547千億[42]。The combined GDP of the remaining territories was estimated by multiplying the average Asian(not including China, India or Japan)and African GDP per capita by the combined populations of the remaining Asian and African territories respectively.
参考文献
引用
- Goldsmith(p. 263, 267).
- Level and Rate of Growth of GDP: World and Major Regions, 0-1998AD
- Maddison (2003)
- Level and Rate of Growth of GDP: World and Major Regions, 0-1998AD
- Level and Rate of Growth of GDP: World and Major Regions, 0-1998AD
- Level and Rate of Growth of GDP: World and Major Regions, 0-1998AD
- Level and Rate of Growth of GDP: World and Major Regions, 0-1998AD
- The Economies of the Americas, Five Regions, 1500-2001
- Maddison, 2003
- Level and Rate of Growth of GDP: World and Major Regions, 0-1998AD
- Level and Rate of Growth of GDP: World and Major Regions, 0-1998AD
- Level and Rate of Growth of GDP: World and Major Regions, 0-1998AD
- Level and Rate of Growth of GDP: World and Major Regions, 0-1998AD
- The Economies of the Americas, Five Regions, 1500-2001
- Level and Rate of Growth of GDP: World and Major Regions, 0-1998AD
- Level and Rate of Growth of GDP: World and Major Regions, 0-1998AD
- The Economies of the Americas, Five Regions, 1500-2001
- The Economies of the Americas, Five Regions, 1500-2001
- Level and Rate of Growth of GDP: World and Major Regions, 0-1998AD
- Level and Rate of Growth of GDP: World and Major Regions, 0-1998AD
- The Economies of the Americas, Five Regions, 1500-2001
- The Economies of the Americas, Five Regions, 1500-2001
- Level and Rate of Growth of GDP: World and Major Regions, 0-1998AD
- Level and Rate of Growth of GDP: World and Major Regions, 0-1998AD
- Level and Rate of Growth of GDP: World and Major Regions, 0-1998AD
- Level and Rate of Growth of GDP: World and Major Regions, 0-1998AD
- The Economies of the Americas, Five Regions, 1500-2001
- The Economies of the Americas, Five Regions, 1500-2001
- Level and Rate of Growth of GDP: World and Major Regions, 0-1998AD
- Eastern Europe and Russia (Former USSR area): Population and GDP, 1500-1820
- Level and Rate of Growth of GDP: World and Major Regions, 0-1998AD
- The Economies of the Americas, Five Regions, 1500-2001
- Level and Rate of Growth of GDP: World and Major Regions, 0-1998AD
- The Economies of the Americas, Five Regions, 1500-2001
- The Economies of the Americas, Five Regions, 1500-2001
- Maddison, 2006
- The Economies of the Americas, Five Regions, 1500-2001
- Level and Rate of Growth of GDP: World and Major Regions, 0-1998AD
- Level and Rate of Growth of GDP: World and Major Regions, 0-1998AD
- The Economies of the Americas, Five Regions, 1500-2001
- Maddison, 2006
- The Economies of the Americas, Five Regions, 1500-2001
- Angus Maddison(1998 & 2001)
- The Economies of the Americas, Five Regions, 1500-2001
- Level and Rate of Growth of GDP: World and Major Regions, 0-1998AD
- Level and Rate of Growth of GDP: World and Major Regions, 0-1998AD
- The Economies of the Americas, Five Regions, 1500-2001
- The Economies of the Americas, Five Regions, 1500-2001
- The Economies of the Americas, Five Regions, 1500-2001
- Level and Rate of Growth of GDP: World and Major Regions, 0-1998AD
- Level and Rate of Growth of GDP: World and Major Regions, 0-1998AD
- The Economies of the Americas, Five Regions, 1500-2001
- The Economies of the Americas, Five Regions, 1500-2001
- Level and Rate of Growth of GDP: World and Major Regions, 0-1998AD
- The Economies of the Americas, Five Regions, 1500-2001
- The Economies of the Americas, Five Regions, 1500-2001
- . [2011-04-14]. (原始内容存档于2020-12-05).
- The Economies of the Americas, Five Regions, 1500-2001
- 世界经济千年史,第259页
- Level and Rate of Growth of GDP: World and Major Regions, 0-1998AD
- The Economies of the Americas, Five Regions, 1500-2001
- 世界经济千年统计,第174页。
- 世界经济千年统计,第266页。
- 世界经济千年统计,第266页。
- IMF 2016 data
来源
- 《世界经济千年史》(英文名:The World Economy: A Millennial Perspective),[英]安格斯·麦迪森(Angus Maddison)著,伍晓鹰、许宪春、叶燕斐施发启译,北京大学出版社2003年11月第一版。
- 《世界经济千年统计》(英文名:The World Economy: Historical Statistics),[英]安格斯·麦迪森(Angus Maddison)著,伍晓鹰、施发启 译,北京大学出版社2009年1月第一版。
- 《中国经济的长期表现,公元960-2030年》第二版(英文名:Chinese Economic Performance in the Long Run, 960-2030 AD, Second Edition, Revised and Updated),[英]安格斯·麦迪森(Angus Maddison])著,伍晓鹰、马德斌译,上海人民出版社2008年3月第一版。
- Angus Maddison(2001). The World Economy: A Millennial Perspective, OECD, Paris.
- Angus Maddison(2003). The World Economy: Historical Statistics, OECD, Paris.
- Angus Maddison(2007). Chinese Economic Performance in the Long Run, 960-2030 AD, Second Edition, Revised and Updated , OECD, Paris.
- Goldsmith, Raymond W. . Review of Income and Wealth. 1984, 30 (3): 263–288. doi:10.1111/j.1475-4991.1984.tb00552.x.
- Milanovic, Branko. . Review of Income and Wealth. 2006, 52 (3): 449–470. doi:10.1111/j.1475-4991.2006.00198.x.
外部链接
This article is issued from Wikipedia. The text is licensed under Creative Commons - Attribution - Sharealike. Additional terms may apply for the media files.
