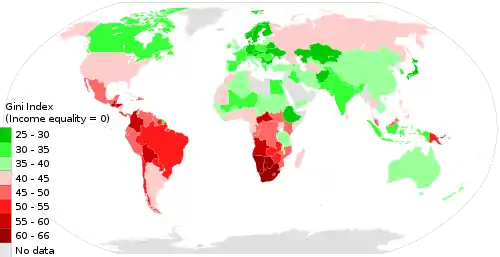
各国收入均衡列表
列表
R/P 10%表示10%最富的除以10%最穷的,R/P 20%表示20%最富的除以20%最穷的;联合国表示数据来自联合国发展计划;CIA表示数据来自中央情报局的世界概况
| 国家/地区 | 联合国 R/P 10%[2] | 联合国 R/P 20%[3] | 世界银行基尼系数[4] | 年份 | CIA R/P 10%[5] | 年份 | CIA基尼系数[6] | 年份 | GPI基尼系数2008[7] |
|---|---|---|---|---|---|---|---|---|---|
| 27.8 | 2008 | 29.4 | 2008 | 60.0 | |||||
| 7.2 | 4.8 | 34.5 | 2008 | 7.2 | 2004 | 34.5 | 2008 | ||
| 9.6 | 6.1 | 35.3 | 1995 | 9.6 | 1995 | 35.3 | 1995 | ||
| 58.6 | 2000 | 62.0 | |||||||
| 31.6 | 17.8 | 36.4 | 2012 | 35.0 | 2007 Jan.-Mar. | 45.8 | 2009 | ||
| 8.0 | 5.0 | 30.9 | 2008 | 25.8 | 2004 | 30.9 | 2008 | ||
| 12.5 | 7.0 | 30.5 | 2006 | 12.7 | 1994 | 30.3 | 2008 | ||
| 6.9 | 4.4 | 26.0 | 2007 | 6.8 | 2004 | 26.0 | 2007 | ||
| 9.7 | 6.0 | 33.7 | 2008 | 9.5 | 2001 | 33.7 | 2008 | ||
| 36.0 | |||||||||
| 7.5 | 4.9 | 32.1 | 2010 | 7.5 | 2000 est. | 33.2 | 2005 | ||
| 6.9 | 4.5 | 27.2 | 2008 | 6.9 | 2002 | 27.2 | 2008 | ||
| 8.2 | 4.9 | 33.0 | 2000 | 8.3 | 2000 | 28.0 | 2005 | ||
| 53.1 | 1999 | 49.2 | |||||||
| 9.4 | 6.0 | 38.6 | 2003 | 9.4 | 2003 | 36.5 | 2003 | ||
| 38.1 | 2007 | 32 | |||||||
| 93.9 | 42.3 | 56.3 | 2008 | 157.3 | 2002 | 53 | 2010 | ||
| 5.4 | 3.8 | 36.2 | 2007 | 5.5 | 2001 | 36.2 | 2007 | ||
| 43.0 | 20.4 | 61.0 | 1994 | 63 | 1993 | ||||
| 40.6 | 21.8 | 54.7 | 2009 | 37.1 | 2007 | 50.8 | 2012 | ||
| 7.0 | 4.4 | 28.2 | 2007 | 8.8 | 2005 | 45.3 | 2007 | ||
| 11.6 | 6.9 | 39.8 | 2009 | 11.5 | 2003 | 39.5 | 2007 | ||
| 19.3 | 9.5 | 33.3 | 2006 | 19.3 | 1998 | 42.4 | 1998 | ||
| 12.2 | 7.3 | 37.9 | 2008 | 12.0 | 2004 | 37.9 | 2008 est. | ||
| 15.7 | 9.1 | 38.9 | 2007 | 15.4 | 2001 | 44.6 | 2001 | ||
| 9.4 | 5.5 | 32.6 | 2000 | 9.5 | 2000 | 32.1 | 2005 | ||
| 50.5 | 2002 | ||||||||
| 69.2 | 32.7 | 56.3 | 2008 | 68.1 | 1993 | 61.3 | 1993 | ||
| 39.8 | 2003 | 52.3 | |||||||
| 26.2 | 15.7 | 52.1 | 2009 | 32.1 | 2003 | 52.1 | 2009 | ||
| 21.6 | 12.2 | 47.0 | 2007 | 21.8 | 2004 | 46.5 | 2016 | 46.9[8] | |
| 60.4 | 25.3 | 55.9 | 2010 | 56.3 | 2008 | 58.5 | 2011 | ||
| 64.3 | 2004 | ||||||||
| 44.4 | 2006 | 55 | |||||||
| 47.3 | 2005 | 56.2 | |||||||
| 23.4 | 15.6 | 50.7 | 2009 | 37.4 | 2003 | 50.3 | 2009 | ||
| 16.6 | 9.7 | 41.5 | 2008 | 17.0 | 2002 | 41.5 | 2008 | ||
| 7.3 | 4.8 | 33.7 | 2008 | 7.2 | 2003 est. | 32 | 2010 | ||
| 30.0 | |||||||||
| 29.0 | 2005 | ||||||||
| 5.2 | 3.5 | 26.0 | 2005 | 5.2 | 1996 | 31.0 | 2009 | ||
| 8.1 | 4.3 | 24.0 | 2005 | 12.0 | 2000 est. | 24.8 | 2011 est. | ||
| 40.0 | 2002 | ||||||||
| 25.3 | 14.3 | 47.2 | 2010 | 29.4 | 2005 | 47.2 | 2010 est. | ||
| 35.2 | 17.3 | 49.3 | 2010 | 17.5 | 2006 Oct.[9] | 47.7 | 2012 Dec.[10] | ||
| 8.0 | 5.1 | 30.8 | 2008 | 8.0 | 2000 | 34.4 | 2001 | ||
| 38.6 | 20.9 | 48.3 | 2009 | 55.4 | 2002 | 46.9 | 2007 | ||
| 65 | |||||||||
| 10.8 | 6.4 | 36.0 | 2004 | 11.0 | 2003 | 31.3 | 2010 | ||
| 6.6 | 4.3 | 29.8 | 2005 | 6.5 | 2000 | 30.0 | 2000 | ||
| 30.4 | 2009 est. | ||||||||
| 42.8 | 2009 | ||||||||
| 5.6 | 3.8 | 26.9 | 2000 | 5.7 | 2000 | 26.8 | 2008 | ||
| 9.1 | 5.6 | 32.7 | 2008 | 8.3 | 2004 | 32.7 | 2008 | ||
| 41.5 | 2005 | 60 | |||||||
| 20.2 | 11.2 | 47.3 | 2003 | 20.6 | 1998 | 50.2 | 1998 | ||
| 15.4 | 8.3 | 41.3 | 2008 | 15.2 | 2003 | 46 | 2011 | ||
| 6.9 | 4.3 | 28.3 | 2000 | 6.9 | 2000 | 27.0 | 2006 | ||
| 14.1 | 8.4 | 42.8 | 2006 | 13.7 | 1999 | 39.4 | 2005–2006 | ||
| 10.2 | 6.2 | 34.3 | 2000 | 10.4 | 2000 est. | 33.0 | 2005 | ||
| 33.9 | 20.3 | 55.9 | 2006 | 48.2 | 2002 | 55.1 | 2007 | ||
| 10.5 | 6.6 | 39.4 | 2007 | 21.6 | 2006 | 39.4 | 2007 | ||
| 19.0 | 10.3 | 35.5 | 2002 | 84.8 | 1991 | ||||
| 44.5 | 1998 | 26.0 | 1999 | 44.6 | 2007 | ||||
| 54.4 | 26.6 | 59.2 | 2001 | 68.1 | 2001 | 59.2 | 2001 | ||
| 59.4 | 17.2 | 57.0 | 2009 | 35.2 | 2003 | 57.7 | 2007 | ||
| 17.8 | 9.7 | 53.3 | 2007 | 53.7 | 2011 | ||||
| 5.5 | 3.8 | 31.2 | 2007 | 5.6 | 2002 | 24.7 | 2009 | ||
| 28.0 | 2006 | ||||||||
| 8.6 | 5.6 | 33.4 | 2005 | 8.6 | 2004 | 36.8 | 2004 | ||
| 7.8 | 5.2 | 34.0 | 2005 | 7.9 | 2002 | 36.8 | 2009 | ||
| 17.2 | 9.7 | 38.3 | 2005 | 16.9 | 1998 | 44.5 | 2006 | 38.3[11] | |
| 30.9 | 2007 | 42 | |||||||
| 9.4 | 5.6 | 34.3 | 2000 | 9.4 | 2000 | 33.9 | 2010 | ||
| 13.4 | 7.9 | 39.2 | 2001 | 11.8 | 2005 | 39.2 | 2008 | ||
| 11.6 | 6.5 | 36.0 | 2000 | 11.7 | 2000 | 31.9 | 2011 | ||
| 17.3 | 9.8 | 45.5 | 2004 | 17.0 | 2004 | 45.5 | 2004 | ||
| 4.5 | 3.4 | 38.1 | 2002 | 4.5 | 1993 | 37.6 | 2008 | ||
| 11.3 | 6.9 | 35.4 | 2010 | 11.3 | 2003 | 39.7 | 2007 | ||
| 8.5 | 5.6 | 29.0 | 2009 | 8.0 | 2004 est. | 28.9 | 2011 | ||
| 13.6 | 8.2 | 47.7 | 2005 | 18.6 | 2000 | 42.5 | 2008 est. | ||
| 31.0 | |||||||||
| 7.8 | 4.7 | 31.3 | 2007 | 8.6 | 2005 est. | 41.9 | 2011 | ||
| 30 | |||||||||
| 6.4 | 4.4 | 36.2 | 2009 | 6.4 | 2003 | 33.4 | 2007 | ||
| 8.3 | 5.4 | 36.7 | 2008 | 8.4 | 2002 | 36.7 | 2008 | ||
| 11.6 | 6.8 | 36.6 | 2008 | 11.6 | 2003 | 35.2 | 2010 | ||
| 45 | |||||||||
| 10.5 | 44.2 | 52.5 | 2003 | 48.2 | 2002 est. | 63.2 | 1995 | ||
| 12.8 | 38.2 | 2007 | 38.2 | 2007 | |||||
| 36.0 | |||||||||
| 10.4 | 6.3 | 37.6 | 2008 | 10.3 | 2003 | 35.5 | 2009 | ||
| 30.8 | 2000 | 6.8 | 2000 | 26.0 | 2005 | ||||
| 12.5 | 7.5 | 43.2 | 2009 | 12.3 | 2003 | 43.2 | 2009 | ||
| 19.2 | 11.0 | 44.1 | 2010 | 19.3 | 2001 | 47.5 | 2001 | ||
| 10.9 | 6.7 | 39.0 | 2004 | 11.0 | 2004 | 39.0 | 2004 | ||
| 22.1 | 12.4 | 46.2 | 2009 | 28.0 | 2003 est. | 46.2 | 2009 | ||
| 37.4 | 2004 | ||||||||
| 12.5 | 7.6 | 33.0 | 2010 | 12.6 | 2001 | 40.1 | 2001 | ||
| 27.4 | 2011 | ||||||||
| 12.0 | 7.4 | 40.5 | 2008 | 11.8 | 2000 | 39.0 | 2000 | ||
| 39.0 | 2006 est. | ||||||||
| 21.6 | 12.8 | 48.3 | 2008 | 24.6 | 2004 | 51.7 | 2008 | ||
| 8.2 | 5.3 | 33.0 | 2010 | 8.3 | 2003 | 38.0 | 2008 | ||
| 8.2 | 5.4 | 36.5 | 2008 | 8.2 | 2002 | 36.5 | 2008 | ||
| 30.0 | 2008 | 24.3 | 2010 | ||||||
| 11.7 | 7.2 | 40.9 | 2007 | 11.9 | 1999 | 40.9 | 2007 est. | ||
| 18.8 | 9.9 | 45.7 | 2008 | 18.8 | 2002 | 45.6 | 2008 | ||
| 11.6 | 1998 | 40 | |||||||
| 12.8 | 56.1 | 63.9 | 2004 | 129.0 | 2003 | 59.7 | 2010 | ||
| 15.8 | 9.1 | 32.8 | 2010 | 15.6 | 2004 | 32.8 | 2010 | ||
| 9.2 | 5.1 | 30.9 | 2007 | 9.2 | 1999 | 30.9 | 2007 | ||
| 12.4 | 6.8 | 36.2 | 1997 | 36.2 | 1997 | ||||
| 31.0 | 8.8 | 40.5 | 2005 | 15.4 | 2001 | 40.5 | 2010 | ||
| 46.0 | 20.7 | 34.6 | 2008 | 44.3 | 1995 | 34.0 | 2007 | ||
| 17.8 | 9.7 | 48.8 | 2010 | 17.5 | 2003 | 43.7 | 2003 | ||
| 6.1 | 3.9 | 25.8 | 2000 | 6.0 | 2000 | 25.0 | 2008 | ||
| 32 | |||||||||
| 6.5 | 4.3 | 30.0 | 2008 | 6.6 | 2002 | 30.6 | 2007–2008 | ||
| 49.9 | 23.9 | 51.9 | 2010 | 61.4 | 2003 | 51.9 | 2010 est. | ||
| 23.8 | 12.6 | 50.9 | 1996 | 23.8 | 1996 | 50.9 | 1996 | ||
| 38.8 | 25.7 | 52.4 | 2010 | 65.9 | 2003 | 53.2 | 2009 | ||
| 26.1 | 15.2 | 48.1 | 2010 | 31.5 | 2003 | 46.0 | 2010 | ||
| 15.5 | 9.3 | 43.0 | 2009 | 15.5 | 2003 | 44.8 | 2009 | ||
| 8.8 | 5.6 | 34.1 | 2009 | 8.7 | 2002 | 34.1 | 2009 | ||
| 15.0 | 8.0 | 38.5 | 2007 | 9.2 | 1995 est. | 38.5 | 2007 | ||
| 41.1 | 2007 | 39 | |||||||
| 7.5 | 4.9 | 30.0 | 2009 | 7.4 | 2003 | 33.2 | 2011 | ||
| 12.7 | 7.6 | 40.1 | 2009 | 12.8 | 2002 | 41.7 | 2011 | ||
| 18.6 | 9.9 | 50.8 | 2011 | 18.2 | 2000 | 46.8 | 2000 | ||
| 50.8 | 2001 | ||||||||
| 32.0 | |||||||||
| 12.3 | 7.4 | 39.2 | 2005 | 12.4 | 2001 | 41.3 | 2001 | ||
| 27.8 | 2009 | 28.2 | 2008 | ||||||
| 65.8 | 2007 | ||||||||
| 87.2 | 57.6 | 42.5 | 2003 | 87.2 | 1989 | 62.9 | 1989 | ||
| 17.7 | 9.7 | 37.0[12] | 2014 | 17.3 | 1998 | 45.8 | 2016 | ||
| 6.7 | 4.0 | 26.0 | 2009 | 6.7 | 1996 | 26.0 | 2005 | ||
| 5.9 | 3.9 | 31.2 | 2004 | 5.9 | 1998 | 23.8 | 2011 | ||
| 30 | |||||||||
| 33.1 | 17.9 | 63.1 | 2009 | 31.9 | 2000 | 65.0 | 2005 | ||
| 45.5 | 2009 | ||||||||
| 10.3 | 6.0 | 34.7 | 2000 | 10.2 | 2000 | 32.0 | 2005 | ||
| 11.1 | 6.9 | 40.3 | 2007 | 36.1 | 2003/04 fiscal year | 49.0 | 2010 | ||
| 42.6 | 1995 | ||||||||
| 35.3 | 2009 | 51 | |||||||
| 52.9 | 1999 | ||||||||
| 25.1 | 13.0 | 51.5 | 2010 | 25.4 | 2001 | 50.4 | 2001 | ||
| 6.2 | 4.0 | 25.0 | 2000 | 6.2 | 2000 | 23.0 | 2005 | ||
| 9.0 | 5.5 | 33.7 | 2000 | 8.9 | 2000 | 29.6 | 2010 | ||
| 35.8 | 2004 | 42.0 | |||||||
| 6.1 | 2002 est. | 33.6 | 2014 | ||||||
| 7.8 | 5.2 | 30.8 | 2009 | 7.8 | 2003 | 32.6 | 2006 | ||
| 9.2 | 5.8 | 37.6 | 2007 | 9.3 | 2000 | 37.6 | 2007 | ||
| 12.6 | 7.7 | 40.0 | 2009 | 12.4 | 2002 | 53.6 | 2009 | ||
| 31.9 | 2007 | 31.9 | 2007 est. | ||||||
| 34.4 | 2006 | ||||||||
| 12.9 | 7.6 | 40.3 | 1992 | ||||||
| 13.4 | 7.9 | 41.4 | 2005 | 13.7 | 2000 | 40.0 | 2005 est. | ||
| 6.6 | 4.6 | 39.0 | 2008 | 17.1 | 2003 | 40.2 | 2010 | ||
| 12.3 | 7.7 | 40.8 | 1998 | 12.2 | 1998 | 40.8 | 1998 | ||
| 16.6 | 9.2 | 44.3 | 2009 | 16.4 | 2002 | 44.3 | 2009 | ||
| 5.9 | 4.1 | 26.4 | 2009 | 7.6 | 2006 | 28.2 | 2009 | ||
| 31 | |||||||||
| 13.8 | 7.2 | 34.0 | 2005 | 13.6 | 1999 | 40 | 2008-2009 | ||
| 15.9 | 8.4 | 45 | 2007 | 15.0 | 2007 est. | 45.0 | 2007 | ||
| 20.1 | 10.2 | 45.3 | 2010 | 17.9 | 2003 | 45.3 | 2010 | ||
| 10.6 | 6.2 | 36.7 | 2003 | 10.6 | 2003 | 36.8 | 2003 | ||
| 18.8 | 16.0 | 44.8 | 2006 | 50.3 | 2003 | 39.0 | 2011 | ||
| 6.9 | 4.9 | 35.6 | 2008 | 10.0 | 2004 | 37.6 | 2008 | ||
| 35.5 | 2009 | ||||||||
| 8.6 | 5.6 | 37.7 | 2005 | 8.6 | 2003 | 37.7 | 2005 | ||
| 54.6 | 2006 | 50.8 | 2004 | ||||||
| 50.1 | 1995 | 50.1 | 2006 | ||||||
| World | 12.0 | 2002 est. | 39 | 2007 |
参见
- 人类发展指数
- 不平等指数
- 多维贫困指数
参考
- Table 2.9 of World Development Indicators: Distribution of income or consumption 页面存档备份,存于 The World Bank (2014)
- Data show the ratio of the income or expenditure share of the richest group to that of the poorest. Inequality in income or expenditure / 收入不平等测量,10%最富的除以10%最穷的比率 页面存档备份,存于,人类发展报告 2007/08, UNDP, 2008年2月3日。Note: Because the underlying household surveys differ in method and in the type of data collected, the distribution data are not strictly comparable across countries.
- Data show the ratio of the income or expenditure share of the richest group to that of the poorest. Inequality in income or expenditure / Inequality measures, ratio of richest 20% to poorest 20% 页面存档备份,存于, 人类发展报告 2007/08, UNDP, accessed on 2008年2月3日. Note: Because the underlying household surveys differ in method and in the type of data collected, the distribution data are not strictly comparable across countries.
- World Bank GINI index 页面存档备份,存于, accessed on November 24, 2011.
- Data show the ratio of the household income or consumption share of the richest group to that of the poorest. Household income or consumption by percentage share (%) 页面存档备份,存于, 世界概况, CIA, updated on 1月24日 2008年. Note: To calculate the value given in the table for this article, the highest 10% value was divided by the lowest 10% value.
- Distribution of family income - Gini index 页面存档备份,存于, 世界概况, CIA, updated on 2008年1月24日.
- 全球和平指数 calculation incorporates UN Gini scores where available, so countries with a UN Gini calculation are left blank in this column. At . [2013-03-03]. (原始内容存档于2010-03-30). click on each country to see its Gini coefficient. Calculated in 2008.
- Stephen Young (2010) Geni Coefficient Nation Multimedia 页面存档备份,存于
- Data for urban households only.
- Data for urban households only.
- (PDF). [2013-08-16]. (原始内容存档 (PDF)于2009-11-22).
- . [2016-07-29]. (原始内容存档于2016-08-21).
This article is issued from Wikipedia. The text is licensed under Creative Commons - Attribution - Sharealike. Additional terms may apply for the media files.
